

Choosing a Data Quality Tool
A guide to figuring out the specific need and picking a tool that either observes, alerts, stops a pipeline, or all of the above.

This post is not a sponsored post. When I was evaluating data quality tools, I felt there wasn’t enough vendor neutral content to understand what kind of approaches are common and what tools exist. The goal of this post is to fit that need at a high level.

An executive dashboard had an inaccurate metric one too many times and a reverse ETL sync sent incomplete data just last week. In both cases, stakeholders came to the analytics team with the issue instead of the other way around.
As a data team, not knowing when the products you build are broken will slowly ruin data trust and make stakeholders doubt and work around you.
Having people work around the analytics team means duplicate work is performed. Clearly unproductive. If the organization didn’t prioritize data quality from the first data hire, it’s paramount to mitigate issues before causing any further harm to data trust.
So you, as the Lead Analytics Engineer, have decided. You want things to break less and if in the off chance you’re one of these people that can’t build perfect pipelines, you at least want to know when there’s an issue.

Step1: Define the problem
What are “things”? What does “breaking” mean? Things could be: infrastructure, data pipelines, or upstream data that you have no control over. Breaking could be: not running on schedule, failing mid run, or running but not up to par with pre-existing expectations.
Data quality is an outcome, with many tools providing a path there. Tools label and marketing themselves in a variety of categories including data quality, data observability, data governance, cloud monitoring, and more. There’s a dozen tools out there, but getting budgeting approval for several is an uphill battle.
Choosing a tool is about answering the question: what does data quality mean to your organization?
Let’s go back to that problematic executive dashboard and the reverse ETL sync with freshness issues. The problem(s) could be any of the following:
A change to an aggregation in SQL code accidentally sums over underlying data with nulls, nulling out the column values entirely
Underlying data shouldn’t contain nulls but suddenly does
Cloud infrastructure orchestrating SQL or Python transformations (Airflow, Prefect, Dagster, etc) fell over due to overwhelmed resources like memory or CPU
A column was renamed somewhere, causing downstream transformations to reference a column that no longer exists and subsequently fail
Percentages were described as integers ranging from 0-100, but are now ratios ranging from 0-1
The list goes on. This all contributes to data quality, and at some point there will be a holistic tool that helps identify all of these cases. For now, different tools approach data quality problems in different ways.
Let’s dive in: what tools exist and what approach do they each take to data quality?
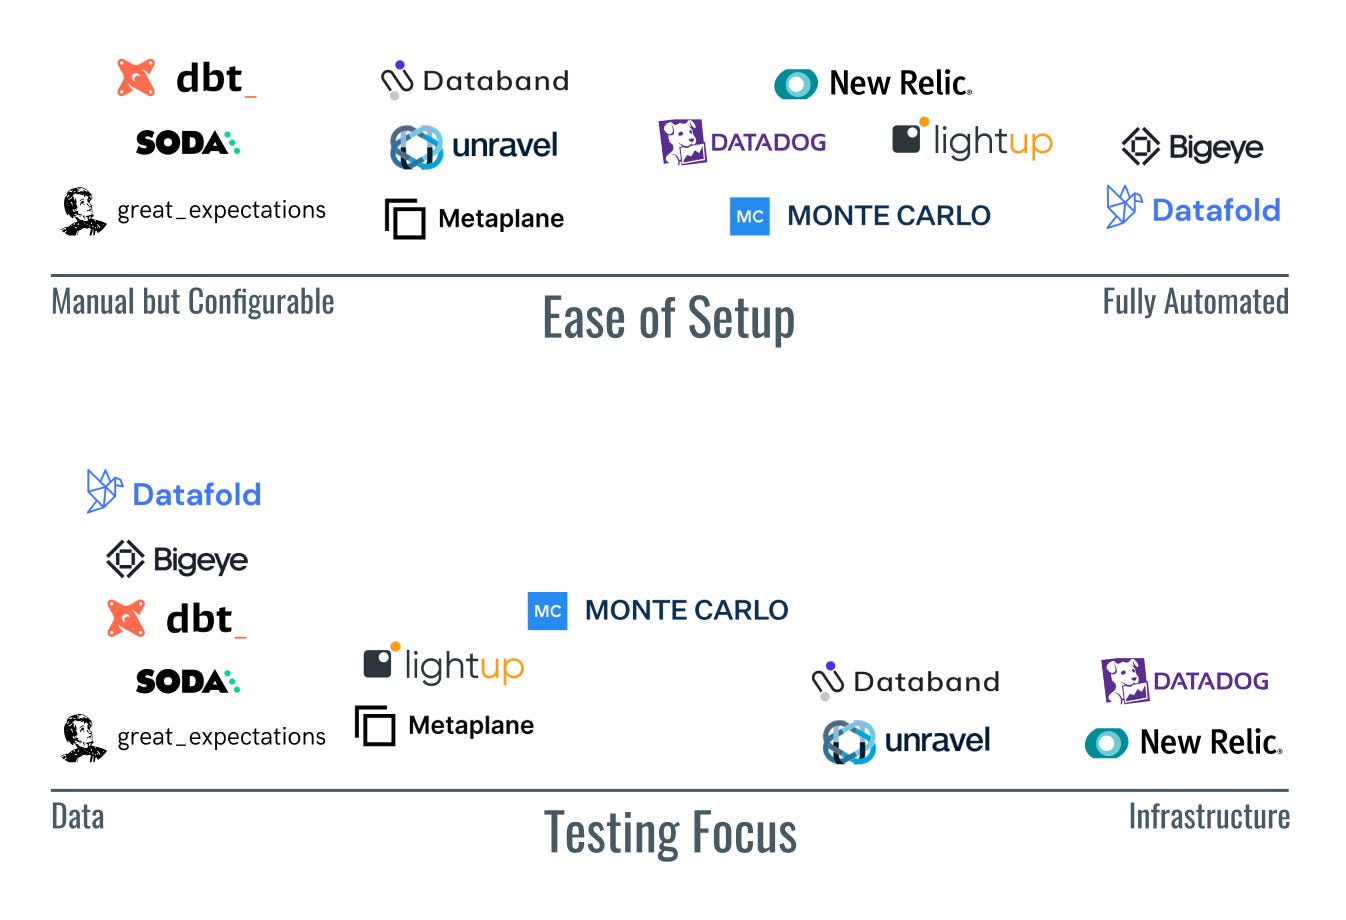
Step 2: Understand the tooling landscape
Auto-profiling data
General characteristics: Hosted tools that automatically profile data through either machine learning or statistical methods and alert upon changes based on historical behavior. No one can foresee every possible error or drift, which is where automated solutions save the day.
Pros: Hosted, auto-detection of behavioral change in data, visualizing of lineage and data diffs
Cons: Expensive, less customization, less integration with data pipelines to stop pipeline tasks from propagating issues downstream
Choose if: Your team has a high budget, many data sources you don’t control, and fewer technical resources or time to create and maintain custom tests.
Solutions:
Bigeye: unique in wide range of ML-driven automatic threshold tests and alerts
Datafold: unique Github integration presenting Data Diff between environments with custom tests
Monte Carlo: unique in being most enterprise ready with many data lake integrations
Lightup: unique self-hosted deployment option, appealing to highly regulated industries
Metaplane: unique in high level of configuration for a hosted tool with both out-of-the-box and custom tests
Pipeline testing
General characteristics: Open source (free) with paid cloud option to integrate directly into data pipelines, configuring very granular unit tests to stop downstream tasks from running if data doesn’t meet the specific acceptance criteria.
Pros: Open source with large communities, highly configurable and highly granular tests, tools work as a gate in existing workflows preventing issues from propagating downstream
Cons: Using open source requires development time, test coverage relies on time coding specific tests
Choose if: Your team wants to start with a free solution. You want to have high control and deep granularity into testing while easily integrating with and influencing the result of existing pipelines.
Solutions:
Great Expectations: unique in its data quality specific community and automatic documentation of tests
Soda: unique in its self-hosted cloud option
dbt tests: unique in integration with dbt core and dbt Cloud builds (naturally), but not as versatile outside of the dbt ecosystem
Infrastructure monitoring
General characteristics: Hosted tools to monitor cloud (AWS, GCP, Azure) infrastructure, alerting on thresholds for resource utilization and availability.
Pros: Fairly standalone and easily supplement any strictly data testing tool, monitors cloud infrastructure directly instead of data throughput
Cons: Not data centric
Choose if: Your team is responsible for data platform infrastructure and wants to leverage common engineering tools to alert when infrastructure isn’t scaling well.
Solutions:
Datadog: unique agent implementation that can be deployed anywhere for monitoring even at the container level with custom Airflow metric reporting
New Relic: unique one-step integration with the big 3 cloud platforms with easy alert set up for metrics like CPU/memory
A little bit of everything
General characteristics: Attempted unification of infrastructure monitoring and auto-profiling data, made specifically for analytics professional and common data tools like Airflow and Spark.
Pros: Tools sit in both infrastructure monitoring and auto-profiling with features from both categories
Cons: Don’t go deep into either infrastructure health or level of rigor in auto-profiling, lacking some key features in both
Choose if: You’d like to start with a single solution for auto-profiling and infrastructure monitoring to get the ball rolling and already use tools these companies integrate with.
Solutions:
Databand: unique integration with Airflow and specific Airflow metric monitoring
Unravel: unique support for other data sources like Spark, data lake, and NoSQL databases
Step 3: Making a choice
Let’s go back to the potential issues in the broken executive dashboard or reverse ETL.
Underlying data containing nulls or being different is a classic case for auto-profiling. There will always be more underlying data the analytics team doesn’t own, and building unit tests for all of it takes a lot of time.
Changes to transformation logic having bugs means pipeline unit tests need to exist to automatically detect those bugs.
Infrastructure falling over is a symptom of not knowing when resources are overworked. Alerting on over consumption of CPU, memory, and other typical infrastructure metrics will give the team time to respond before failures occur.
Understanding your organization’s budget and your team’s skillset is the first thing to evaluate. With a highly technical team and low budget, open source is the winner. With an understaffed team focused more on servicing the rest of the organization data, auto-profiling will save a lot of time.
The above is not meant to be a full list of features for each tool. For instance, Bigeye came out with a data diff feature rivaling Datafold’s. I also have’t used every tool in this list. To pick within a category, demoing the tool will expose features that might be game changers for your specific organization or lacking functionality that you didn’t realize was critical.
Thanks for reading! I love talking data stacks. Shoot me a message.
Shout out to Paul Singman and Pedram Navid for their feedback on drafts of the post.
"Your team wants to start with a free solution"
Free is never really free. I have found that developers are attracted to open source "free" tools because they like the challenge and are tinkers by nature. We need tinkers. But, it cost in terms of productivity and maintenance over time. Free to download. Free to use. But not free to the project.
Love the write up and sharing of your findings. I look forward to more.
Great article! I think it's a fine balance between money, time, and knowledge. Unfortunately those that have smaller teams are also those with smaller budgets. AND those that need the expensive automated tools the most!